
![]()
![]()
Tech Report is one of the oldest hardware, news, and tech review sites on the internet. We write helpful technology guides, unbiased product reviews, and report on the latest tech and crypto news. We maintain editorial independence and consider content quality and factual accuracy to be non-negotiable.
We found all the key YouTube Shorts statistics that reveal the rapid growth the platform experienced over the past few years. It turns out that more people are tuning in to watch and create YouTube shorts, and marketers are also turning their attention to YouTube shorts to reach a wider audience.
However, YouTube isn’t the only platform profiting from the short video format. TikTok, Instagram, and Facebook take the largest large chunk of the pie right now, and these recent YouTube statistics reveal how these platforms compare.
Keep reading to see where YouTube Shorts stands against the competition, and discover the platform’s latest viewership, demographics, engagement, and advertisement figures.
-
-
Key YouTube Shorts Statistics to Know In 2024
- YouTube is the second largest website after Google, averaging 113 billion monthly visits.
- YouTube is also the second most popular social network after Facebook, with an average of 2.5 billion monthly active users.
- YouTube’s audience skews young, with 25–34 year olds accounting for the largest share of the platform’s users.
- India and the US have the largest YouTube audiences, with 476 million and 238 million YouTube users, respectively.
- South Korean users spend the most time on YouTube’s app – an average of 45.49 hours a month, compared to the global average of 27.43. The US average is 25.56 hours.
- YouTube Shorts has 2 billion monthly logged in users. In the US, the estimated number of monthly YouTube Shorts users is forecasted to reach 164.5 million by the end of 2024.
- The number of daily YouTube Shorts views reached 70 billion in 2023.
- Over 750,000 people are currently making money as YouTube Shorts creators.
- YouTube Shorts have higher engagement rates than long videos, generating almost nine times more interactions on average. The average short also receives 37.44 likes, twice as many as a long-form video.
- TikTok is still the leading short video platform among US viewers and advertisers. 75% of US marketers said they used TikTok. TikTok videos also average 28 times more views than YouTube shorts.
- With the exception of Facebook reels, the average engagement rate is similar among Youtube Shorts, TikTok, and Instagram reels, at over 5.5%.
- YouTube could be gaining traction among marketers worldwide, with 66% planning to increase their YouTube use for marketing purposes.
Overview of General YouTube Trends
Before looking at the latest YouTube Shorts statistics, it’s worth learning more about YouTube as a platform. This will put YouTube’s Shorts into context, and it will also give us the whole picture when comparing YT’s short form video platform to competitors like TikTok.
YouTube Is One of the Most Popular Sites Worldwide
As of 2023, YouTube is the second most popular website worldwide after Google, averaging 113 billion monthly visits.
Another 2023 analysis comparing only websites with user-generated content found YouTube is the most visited platform in the world. However, this comparison only looked at web visits and excluded apps, so TikTok didn’t make it into the top 10 despite its massive popularity.
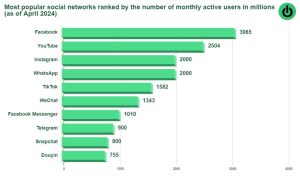
YouTube is also the second most popular social network in the world after Facebook and has an average of 2.5 billion monthly active users as of April 2024.

Like this infographic? Feel free to use it on your website or blog, but please remember to give us credit Info source: Statista In comparison, Instagram and TikTok average 2 billion and 1.58 billion MAU, respectively.
YouTube’s Demographic Data
The majority of people visit YouTube on mobile.While this data applies to YouTube as a whole, these trends can also give us an idea about YouTube Shorts demographics and the average YouTube shorts user.For starters, according to 2023 data, the vast majority of recorded YouTube visits are on mobile, where vertical short form videos are a lot easier to watch and interact with, compared to long form content.
Last December, for example, roughly 97 billion of the YouTube visits recorded were on mobile. Throughout July to December 2023, there were over 6 times more mobile visits than desktop visits recorded.
Who Is The Average YouTube Viewer?
According to 2024 estimates, men make up the majority of YouTube’s user base, with a share of 54.3% of recorded users. However, these figures also count duplicate and inactive accounts, and might not be perfectly representative.

Percentages reflect the share of total audiences regardless of age, so values will not sum to 100%. Source: Statista YouTube’s audience also skews young. 25–34 year olds account for roughly 21% of the platform users, followed by 35–44 year olds at approximately 18%, and 18–24 year olds at 15.7%. Note the age brackets in the graphic above don’t include YouTube users under 18.
Where YouTube Is Most Popular
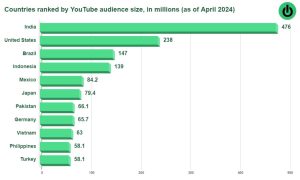
Regarding the countries with the largest YouTube audiences, India is by far the biggest contributor. As of April 2024, India had approximately 476 million YouTube users, twice as many as the US at #2.

Like this infographic? Feel free to use it on your website or blog, but please remember to give us credit Info source: Statista This makes sense, considering India and the US the second and third biggest countries in the world by population, respectively.
Brazil and Indonesia are other major countries with sizable YouTube user bases. If you’re wondering about China, YouTube is blocked by the Great Firewall of China so there’s no audience there, at least none that can be accurately traced.
On a user-by-user basis, though, it seems like YouTube is most popular in South Korea, Russia, and Malaysia according to the average monthly sessions and monthly time spent on YouTube’s app.
Highest number of hours per month spent on YouTube’s mobile app per user in different countries, on average Country Hours/month 🇰🇷South Korea 45.49 🇹🇭Thailand 42.49 🇷🇺Russia 37.25 🇲🇾Malaysia 37.08 🇫🇮Finland 34.08 🇯🇵Japan 33.02 🇷🇴Romania 32.4 🇵🇭Philippines 32.07 🇮🇩Indonesia 31.57 🇸🇬Singapore 29.45 🇧🇬Bulgaria 28.44 🇭🇷Croatia 28.36 🇮🇳India 28.2 🌎Worldwide average 27.43 🇺🇸United States 25.56 South Korea was #1, with users spending an average of 45.49 hours monthly on the YouTube app, or a little over 1.5 hours a day. YouTube app viewers in South Korea also averaged 366.3 mobile sessions a month (roughly 13 sessions a day).
On the other hand, YouTube viewers in the US averaged 25.56 monthly hours (nearly 55 minutes a day) and 231.8 monthly sessions (8.27 sessions a day) on the app. Note these estimates only include Android users.
Still, the US has the most channels with 10+ million followers worldwide, a key milestone for the platform’s diamond button award. As of 2022, the US has 266 major YT creators.
India was the second country in terms of the number of major creators, having 188 channels that surpassed the 10M milestone.
The same year, India had the fastest growing YouTube channel worldwide. YouTube shorts channel ‘Shorts Break’ experienced a 2,130% follower growth in 2022; as of July 2024, it has 41M subscribers.
A Look at The Latest YouTube Shorts Statistics
The YouTube Shorts section has grown rapidly since its introduction in 2020.

Total YouTube Shorts daily views more than doubled since Q2 2021 Source: Statista As of July 2023, YouTube Shorts has 2 billion monthly logged in users – a 34% increase since the previous year. And this is not accounting for the number of shorts viewers without accounts or that use apps like NewPipe or FreeTube, which is likely even higher.
In the US, the estimated number of monthly YouTube Shorts users is nearly 153 million, with a forecast of 164.5 million by the end of 2024.
As for how many people use YouTube shorts to upload content, we can estimate there are over 750k people currently making money as shorts creators through the platform’s partnership program, with many more unmonetized accounts likely uploading shorts as well.
The number of views on YouTube shorts has also skyrocketed from 30 billion in 2021 to 70 billion daily views in 2023. However, it seems that long form content is still king on YouTube, with videos averaging 1,500+ views, compared to shorts with under 650 views.
YouTube Shorts Engagement Statistics
The largest YouTube channels post 0.66 shorts per day on average.Based on 2024 figures, it seems the average YouTube channel posts 3 shorts a week. Large YouTube channels post the most shorts overall, but small accounts are more likely to favor short form content.On average, a YouTube channel with over 50k subscribers posts 0.66 shorts a day, and nearly twice as many long form videos. In comparison, channels with under 10k subscribers post fewer shorts, and even fewer long videos.
Regardless of channel size, YouTube Shorts viewership statistics show that shorts have considerably higher engagement rates than long form videos.

Source: Statista For example, accounts with over 50k followers had an engagement rate of 1.72% on long form videos, and 6.23% on shorts in Q1 2024. Shorts generate almost nine times more interactions on average.
The most common form of interaction for YouTube Shorts is likes and dislikes. YouTube Shorts also collect more likes and dislikes on average, compared to longer videos.

Source: Statista The average short receives 37.44 likes, twice as many as a long-form video. However, longer videos typically receive five times as many comments. These differences in engagement could be due to YouTube’s shorts format.
The like and dislike buttons are bigger, more visible, and readily available on the right side of the screen, and therefore easier to tap or click. Combined with the short video length, viewers can quickly decide if they like the content before scrolling onto the next video.
On the other hand, viewers have to open the comments section in a pop-up window. On long form content, the top rated comment is highlighted under the video, which likely entices more viewers to click and engage with other users.
The Most Viewed YouTube Shorts Videos To Date
As of July 2024, the most viewed YouTube short is Real life transforming Cinderella dress!, by Justin Flom. It was uploaded in November 2022, and currently has 1.644 billion views and 30 million likes.
Overall, comedy and lifestyle are the most popular YouTube Shorts genres, with most other top YouTube shorts falling in these categories. Other top viewed shorts with billions of views include:
- Mountain tribal kid knows how to make an amazing breakfast by Fruits & Nature (1.618 billion views)
- If Cleaning Was a Timed Sport. Part 2 by Daniel LaBelle (1.568 billion views)
- Power Tools Racing Is INTENSE!! by How Ridiculous (1.388 billion views)
- Would You Fly To Paris For A Baguette? By MrBeast (1.308 billion views)
Most of the top watched YouTube shorts are in English, although Arabic and Korean also feature multiple times among the most-viewed shorts.
The most popular foreign language YouTube short to date is اول تجربة لي بالتصوير (My First Experience With Photography), which amassed over 1.3 billion views since March 2023.
How YouTube Shorts Compares to Competing Platforms
YouTube is the most popular social media platform for user-generated content. It has the most monthly visits and the second most monthly active users.
But YouTube Shorts still has a long way to go to surpass competitors, especially TikTok.
However, these YouTube vs TikTok statistics could change in the future. In case TikTok ends up banned following the recent US decision, a lot of current users, creators, and advertisers using TikTok could move onto YouTube, Instagram, or Facebook.
TikTok Is Still the Most Popular Short Video Platform In the US
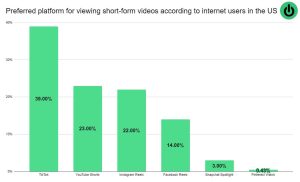
In the US, TikTok is currently the go-to platform for watching short videos. As of 2023, nearly 40% of American respondents claimed to prefer TikTok for viewing short content.

Share of US respondents who prefer watching shorts on YouTube and other platforms Like this infographic? Feel free to use it on your website or blog, but please remember to give us credit Info source: Statista YouTube Shorts was the second choice, being preferred by 23% of respondents. There wasn’t a sizable difference in popularity for YouTube Shorts compared to Instagram, though, as 22% of respondents chose reels.
Americans also spend less time on YouTube shorts compared to TikTok. 2023 estimates show the average person spent roughly 54 minutes a day on TikTok, and 49 minutes on YouTube, although there’s no mention of the time spent on YouTube shorts exclusively.
The leading social media platform in the US differs across age groups, though. Teenagers, for example, spend nearly two hours a day on YouTube and 1.5 hours on TikTok – three to four times more than the average time they spend on Facebook.
These demographic findings also seem to apply to other countries. As found in 2023 a worldwide internet survey, Gen Z is more likely to use TikTok and Instagram, but also less likely to use Facebook, compared to the general population.
Source: Statista Although younger demographics might spend more time on TikTok, the vast majority also use YouTube. There was virtually no difference in the share of YouTube users among Gen Z and the general population.
This goes to show how popular YouTube is overall. However, YouTube shorts in particular are a different story.
YouTube Shorts Get Fewer Views, but More Engagement
As of Q1 2024, YouTube Shorts videos get significantly fewer views on average, compared to Facebook Reels, Instagram Reels, and TikTok.

Source: Statista While YouTube Shorts receive less than 650 views on average, TikTok videos and Facebook and Instagram reels get thousands more.
TikTok is the leading short video platform by far, with an average of 18,173 views per video – 28 times higher than the average views received by YouTube shorts. Instagram is not far behind, with reels receiving over 16,000 views on average.
This difference is especially noticeable when comparing small accounts. YouTube Shorts accounts with 0–500 followers receive an average of 13 views per video, while Instagram and Facebook reels receive over 500 views.

Source: Statista TikToks from tiny accounts receive 1,200 views on average – over twice the views of reels, and 90 times the views of YouTube shorts.
Even when comparing accounts with over 50k followers, the biggest TikTok accounts get 16 times the average views per short, compared to YouTube (91,000+ views, compared to 5,700 views). However, the average engagement rate doesn’t differ much across platforms.
With the exception of Facebook reels, the average engagement rate is similar among Youtube Shorts, TikTok, and Instagram reels, at over 5.5%. As of Q1 2024, YouTube Shorts have the highest average engagement rate of 5.91%, followed by TikTok at 5.75%.

Source: Statista Considering the higher number of views, though, TikToks and Instagram reels seem to get more attention than YouTube shorts. These differences in views could be for various reasons, primarily how each platform’s algorithm operates.
Also, unlike TikTok and Instagram, YouTube is primarily a long-form video platform, so the entire YouTube user base doesn’t necessarily convert to YouTube Shorts viewers.
YouTube Influencer and Advertisement Statistics
YouTube is one of the top platforms for online advertisers.The average weekly time spent watching online videos has been increasing, going from 10.5 hours a week in 2018 to 19 hours a week in 2022.Considering the popularity of YouTube and this near doubling of weekly activity on video platforms overall, we can expect YouTube to remain among the top platforms for online advertisers.
Despite quarterly fluctuations, YouTube’s worldwide ad revenue has been on the rise since 2018. In Q1 2024, the platform’s ad revenue surpassed $8 billion. Since 2020, YouTube’s ad revenue has also been contributing over 10% of Google’s global revenue from all sources.
But even with these strong numbers, YouTube Shorts is still overshadowed by competitors.
General YouTube Shorts Advertisement Trends
As of 2022, TikTok is the leading short video platform for US advertisers. Of the marketing professionals surveyed in the US, 75% said their biggest clients bought ads on TikTok, followed by Instagram reels at 67%.

Source: Statista YouTube Shorts was the third most popular short video advertisement platform, and used by 43% of marketers’ clients.
A larger worldwide survey with over 2,000 respondents had different findings, although it looked at social media platforms overall, not just short video ones.
As of January 2023, Facebook and Instagram were the most popular advertisement platforms globally, being used by 80% or more of marketers. YouTube was in fourth place, used by 54% of respondents. On the other hand, only 26% of marketers claimed to use TikTok.
Although the majority of survey respondents were from the US, it’s worth mentioning the survey also included marketers in India, where TikTok is currently banned, and this might skew the results.
The same global survey found that YouTube could be gaining traction among marketers, with 66% saying they planned to increase their YouTube use for marketing purposes, while only 15% claim to either decrease or not use the platform.

Source: Statista As such, YouTube’s ad revenue could further increase in 2024 and the upcoming years. It’s also worth noting that, as of 2023, YouTube, Instagram, and TikTok also ranked equally for the average return on investment (ROI) – estimated at 16%.
However, we’re yet to see how YouTube’s recent and controversial ad block policy will impact YouTube viewership statistics and Google Ads ROI on the platform.The Latest YouTube Influencer Statistics
YouTube influencers make money through different means, including Google Ads revenue, selling fan merchandise, and through sponsored videos.
Expectedly, the largest YouTube influencers also enjoy the highest engagement and revenue. For example, in 2023, the average engagement rate for YouTube influencers with 100,000+ subscribers was roughly 3.4%, nearly double that of smaller channels.
Furthermore, YouTube influencers with over 50k subscribers record the most advertising impressions, since they reach more viewers. In 2022, accounts with over 50k subscribers had over six times the average ad impressions than smaller channels.

Source: Statista And, as of 2023, these large YouTube channels had nearly 7 average ad impressions. The higher number of impressions translates into higher ad revenue.
According to 2023 estimates, channels with over 50k subscribers generate over 5 times the revenue of smaller channels on average. Besides ad revenue, the largest YouTube influencers also make up to $16,000 per sponsored video or more.
However, these ad impression metrics mainly apply to long form content. For starters, YouTube Shorts monetization only started in February 2023, so we’re yet to see more comprehensive data on shorts revenue.
Secondly, YouTube Shorts revenue is a little different from long form videos. That’s because ads in the shorts feed roll between videos, not during the short itself. This can make it more difficult to calculate ad impressions based on shorts views and channel size.
Additionally, revenue for YouTube shorts is calculated collectively for YouTube’s creator pool in a given region, and then distributed according to the percentage of eligible views per individual video.
Since YouTube shorts deduces the price of music royalties from the collective creator pool, the amount of money distributed across shorts videos can vary dramatically depending on how many creators use copyrighted music in their videos.
While it’s still unclear how much YouTube Shorts creators make on average, being a YouTube influencer can be lucrative, especially for those with large followings who take sponsorship deals.
And with the global influencer marketing market is forecasted to reach $24 billion in 2024, plus a growing number of marketers turning their attention to YouTube, it’s pretty clear YouTube influencers will continue to see significant opportunities for growth and monetization in the coming years.
However, YouTube can also be competitive, with some niches making up a sizable share of the platform’s creators. For example, nearly 30% of YouTube’s influencers fall in the People & Blogs category.

Source: Statista Entertainment was the second most common category, accounting for nearly 15% of influencers on the platform, followed by Video Games at roughly 13%.
As for YouTube Shorts exclusively, it currently ranks second for the recommended daily posting frequency, though not far behind TikTok.
YouTube accounts with 10–50k subscribers should post 3.29 new short videos a week (the equivalent of a short roughly every other day), while accounts with over 50k subscribers should post nearly 5 videos a week.

Source: Statista In comparison, big TikTok accounts should post 4 videos a week, while huge accounts must post nearly once a day.
In this regard, Instagram and Facebook reels creators have an easier time maintaining their social media presence, likely thanks to the lower competition on these platforms.
Wrapping Up
As these YouTube Shorts statistics reveal, YouTube is already one of the leading short video platforms. Since its 2020 release, YouTube Shorts reached 2 billion monthly logged in users and over 750,000 shorts creators enrolled in the platform’s partner program.
With good engagement rates and increasing users, YouTube Shorts is clearly becoming a go-to platform for both viewers and creators. And despite stiff competition, YouTube Shorts is also garnering increasingly more attention from marketers worldwide.
Since people are spending more time than ever watching short video content, the YouTube Shorts audience will likely keep growing in the upcoming years. If TikTok does get banned in the US, YouTube Shorts and Instagram reels could soon get a large influx of new users, particularly among Gen Z.
FAQs
What is a good average percentage viewed on YouTube Shorts?
YouTube Shorts’ algorithm pushes shorts based on topic and user behavior, so the more people see your short, the better. A 70% average percentage viewed or higher is preferable, as it suggests more than 2 in 3 people viewed your short.
Maintaining a high average percentage viewed will encourage the algorithm to keep displaying your video to more users.How successful are YouTube Shorts?
The success of YouTube shorts depends on the metrics observed. The average YouTube short video gets fewer views than the average TikTok, reel, or even long YouTube video. However, YouTube shorts also have good engagement rates of over 5%.
Considering the rapid growth of YouTube Shorts as a platform, there’s a high potential for growing viewership in the near future.How many views do YouTube Shorts usually get?
The average YouTube short receives roughly 647 views, significantly less than TikToks or reels.
This statistic includes views from channels with under 500 to over 50k subscribers. But the number of average views per short can vary drastically across the smallest and biggest channels.Do YouTube Shorts get views easily?
Yes, YouTube shorts tend to get views easier than long form content on the platform. That’s a result of the short video duration, auto-looping features, and the shorts algorithm heavily promoting new videos.
References
Click to expand and view sources- Most popular websites worldwide as of November 2023, by total visits (Statista)
- Worldwide visits to websites hosting user-user generated content in December 2023 (Statista)
- Most popular social networks worldwide as of April 2024, ranked by number of monthly active users (Statista)
- Worldwide visits to YouTube.com from July to December 2023, by device (Statista)
- Distribution of YouTube users worldwide as of April 2024, by gender (Statista)
- Distribution of YouTube users worldwide as of April 2024, by age group and gender (Statista)
- Leading countries based on YouTube audience size as of April 2024 (Statista)
- China’s Great Firewall (Stanford University)
- Number of monthly mobile sessions on the YouTube app in selected countries and territories as of April 2024 (Statista)
- Monthly time spent on the YouTube mobile app per user in selected markets worldwide as of December 2023 (Statista)
- Number of YouTube creators with more than 10 million followers worldwide in September 2022, by country (Statista)
- YouTube Creator Awards (Google)
- Fastest growing YouTube accounts worldwide in 2022, by annual follower growth (Statista)
- Building YouTube Shorts, a new way to watch & create on YouTube (YouTube)
- YouTube Shorts global monthly active usage in 2022 and 2023 (Statista)
- Estimated number of YouTube Shorts users in the United States from 2023 to 2027 (Statista)
- One year in, revenue sharing on Shorts shows how your passion on YouTube pays off (YouTube)
- YouTube Shorts daily views worldwide as of October 2023 (Statista)
- Most popular video format on YouTube worldwide in 1st quarter 2024, by average video views (Statista)
- Average daily number of YouTube Shorts and videos posted worldwide in 1st quarter 2024, by account size (Statista)
- Engagement rate of YouTube Shorts and videos worldwide in 1st quarter 2024, by account size (Statista)
- Most popular video format on YouTube worldwide 1st quarter 2024, by user interactions (Statista)
- Number of comments on YouTube videos worldwide in 1st quarter 2024, by format (Statista)
- Most-viewed YouTube shorts (Wikitubia)
- Why the U.S. Is Forcing TikTok to Be Sold or Banned (The New York Times)
- Preferred social media site or platform for viewing short-form video according to internet users in the United States in March 2023 (Statista)
- Average time spent per day on select social media platforms in the United States in 2023 (Statista)
- Most used social media platforms among Gen Z and internet users worldwide as of September 2023 (Statista)
- Most popular short video platform and features worldwide 1st quarter 2024, average video views (Statista)
- Average video views on most popular social and short video features worldwide 1st quarter 2024, by account size (Statista)
- Social video platform engagement rate worldwide in 1st quarter 2024 (Statista)
- Average weekly time spent with online video worldwide from 2018 to 2023 (Statista)
- Worldwide advertising revenues of YouTube as of 1st quarter 2024 (Statista)
- YouTube’s advertising revenues as percentage of Google’s global revenues from 2017 to 2023 (Statista)
- Most used short video platforms among brands ad companies in the United States according to advertising buyers as of December 2022 (Statista)
- Leading social media platforms used by marketers worldwide as of January 2023 (Statista)
- The ghosts of India’s TikTok: What happens when a social media app is banned (BBC)
- Planned changes in use of selected social media for marketing purposes worldwide as of January 2023 (Statista)
- Social media platforms with the largest return on investment (ROI) according to B2B marketers worldwide as of May 2023 (Statista)
- Allow ads on videos that you watch (Google)
- YouTube influencer engagement rates worldwide in 2023, by follower count (Statista)
- YouTube videos and shorts advertising impressions in 2022 and 2023, by number of subscribers (Statista)
- YouTube videos and shorts estimated ad revenue in 2022 and 2023, by number of subscribers (Statista)
- Average price per sponsored video on YouTube worldwide in 2022, by number of views (Statista)
- YouTube Shorts monetization policies (Google)
- Influencer marketing market size worldwide from 2016 to 2024 (Statista)
- Distribution of YouTube influencers worldwide in 2023, by category (Statista)
- Recommended daily posting frequency on most popular short video platforms and features worldwide as in 1st quarter 2024, by account size (Statista)
 Our Editorial ProcessThe Tech Report editorial policy is centered on providing helpful, accurate content that offers real value to our readers. We only work with experienced writers who have specific knowledge in the topics they cover, including latest developments in technology, online privacy, cryptocurrencies, software, and more. Our editorial policy ensures that each topic is researched and curated by our in-house editors. We maintain rigorous journalistic standards, and every article is 100% written by real authors.
Question & Answers (2)
Have a question? Our panel of experts will answer your queries. Post your QuestionLeave a Reply Cancel reply

Diana Ploscaru Statistics & Tech Content Contributor


Diana Ploscaru Statistics & Tech Content Contributor
View all posts by Diana PloscaruDiana is a seasoned writer with over four years of freelancing experience. Using her keen interest in statistics and data analysis, she specializes in crafting informative and practical content across various interesting topics.
She's also passionate about workflow optimization, constantly researching and trying out the newest tools and project management software. Because it's always exciting to find new ways to streamline daily tasks!
In her free time, she enjoys studying foreign languages and going for hour-long walks to reach her daily step goal.
Latest News

Elon Musk to Move X and SpaceX Headquarters from California to Texas
On Tuesday (July 16), Elon Musk announced that he’s moving the headquarters of his companies X and SpaceX from California to Texas. While SpaceX is moving to Starbase (a company...

AI Startup Anthropic and Menlo Ventures Join Hands to Launch a $100 Million Startup Fund
AI startup Anthropic and its biggest investor Menlo Ventures are launching a $100 million startup fund that will be used to back new startups. Menlo will supply the cash to invest...
REGULATION & HIGH RISK INVESTMENT WARNING: Trading Forex, CFDs and Cryptocurrencies is highly speculative, carries a level of risk and may not be suitable for all investors. You may lose some or all of your invested capital, therefore you should not speculate with capital that you cannot afford to lose. The content on this site should not be considered investment advice. Investing is speculative. When investing your capital is at risk. Please note that we do receive advertising fees for directing users to open an account with the brokers/advertisers and/or for driving traffic to the advertiser website.
Crypto promotions on this site do not comply with the UK Financial Promotions Regime and is not intended for UK consumers.
© Copyright 2024 The Tech Report Inc. All Rights Reserved.
Scroll Up


How many YT shorts are for commercial purposes, ie., not political but selling a product?
Great question, Dustin! We updated our YouTube Shorts Statistics with the latest publicly available data.
Unfortunately, we couldn’t find any good data on the number of commercial vs. non-commercial YouTube Shorts, likely because there’s a chance it violates GDPR laws if it’s not properly anonymized – at least here in the EU.
What we know for sure is that media buying is at the top of marketers’ lists when it comes to advertising – it’s got great engagement and solid ROI. And with YouTube being one of the biggest social platforms, we expect the forecast to be heavily commercial with a touch of informational for the foreseeable future.
Our recommendation is to curate your YouTube feed as much as possible by only subscribing and tuning in to the channels you trust. This should, in theory, make sure the algorithm delivers the content you’d like to see.
Thank you for the comment and for being a reader, Dustin!
Vlad Melnic, Executive Editor @ Tech Report